Control of the simulation and e-learning
Last adaption: 08.2022
New:
notemptyThis article refers to a Resellerpreview
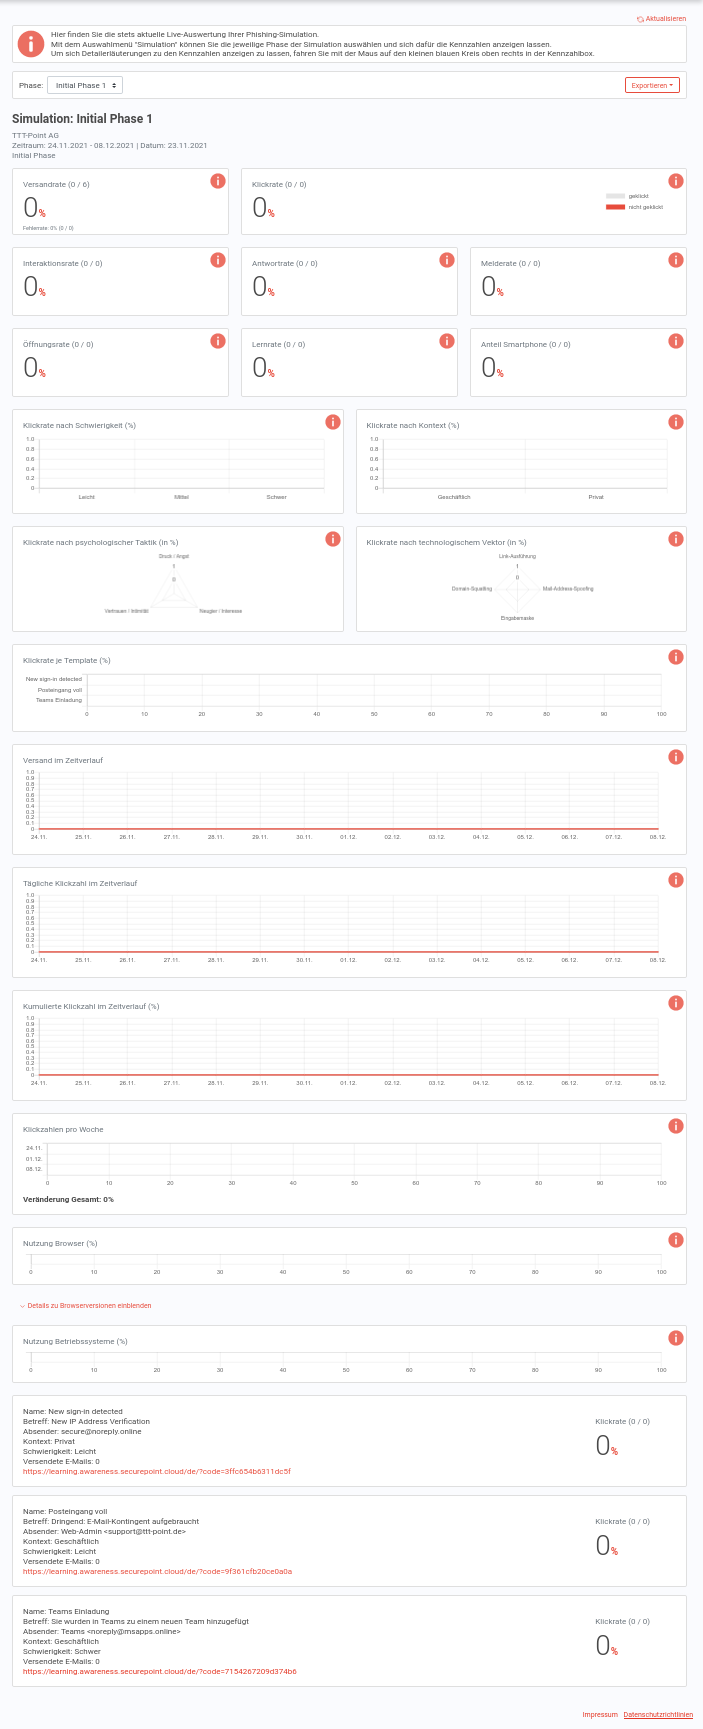
The reporting shows detailed different values in absolute and percentage values.
A printable layout can be displayed.
If the license is cancelled, access to reporting is no longer possible
Reporting
|
Phase selection |
Calls Dialog to create a pdf document with the evaluation
|
Simulation
| Tile title |
Description
|

|
| Dispatch rate |
Number of emails already sent in relation to the total number of planned emails for this phishing simulation. The error rate counts the mails that are rejected by the receiving mail server, e.g. because the recipient address is unknown or the recipient's mailbox is full (quota exhausted).
|
| Click rate |
Percentage of mails sent in which a phishing element (e.g. image, link, "file attachment") was clicked
|
| Interaction rate |
Percentage of phishing emails sent that link to a fake website (this is not the case for all of our phishing emails) where users also click into input fields (e.g. password input field). The simulated reloading of macros or the alleged start of a security scan are also recorded here. There is never any danger. No content is loaded or launched and no passwords can be saved: No passwords can be entered into our fake login screens - users are already taken to the learning page when they click into the password field and receive an education.
|
| Reply rate |
Percentage of sent mails that were actively replied to (but no automatic out-of-office notifications), i.e., users actually replied to our phishing mails here. In an emergency, this is often the starting point for cyber criminals for elaborate social engineering attacks.
|
| Open rate |
Percentage of mails sent that were opened in a mail program where the subsequent download of external images was also allowed (automatically or through user interaction). Since the downloading of external images is often disabled, this does not correspond to the number of phishing emails actually read. The latter key figure cannot be determined.
|
| Learning rate |
Percentage of learning page views after clicking on an element in a phishing email. Reading at least two explanatory texts is counted as a learning page call. Calls to the learning pages via the phishing message button are not counted.
|
| Mobile percentage |
Percentage of views of the learning pages or simulated phishing web pages (after a click on a phishing element) that were viewed on a mobile device (smartphone or tablet).
|
| Click rate by difficulty (%) |
Click rate according to difficulty level of the used templates / templates
|
| Click rate by context (%) |
Click rate according to business or private content of the phishing emails sent out
|
| Click rate according to psychological tactic (in%) |
Our phishing emails are classified by psychological tactics that are used. Here is the total number of clicks on phishing elements in the phishing emails we send, according to these tactics.
|
| Click rate by technological vector (in %) |
Our phishing emails are classified according to technological vectors that are used. Here, the total number of clicks on phishing elements in the phishing emails we send is presented according to these vectors.
|
| Click rate per template (%) |
Click-through rate per template of the phishing emails we send
|
| Dispatch over time |
Phishing mails sent daily. By default, no mail is sent by us on weekends.
|
| Daily number of clicks over time |
Number of clicks on phishing elements in mails sent by us - related to the respective day
|
| Cumulated click rate over time(%) |
Development of the number of clicks (key figure see above) in the course of this phishing simulation
|
| Click rate per week |
Aggregation of the daily click numbers (see above) on a weekly basis. The value of the change below the chart indicates the relative change from the first to the last (in case of an ongoing campaign to the current) week. In case of a reduction of the click rate, a negative number is displayed. In case of an increase in the click rate, a positive number is displayed.
|
| Browser usage (%) |
Shares of the different browsers used in %
|
| Operating systems usage (%) |
Shares of the various operating systems used in %
|
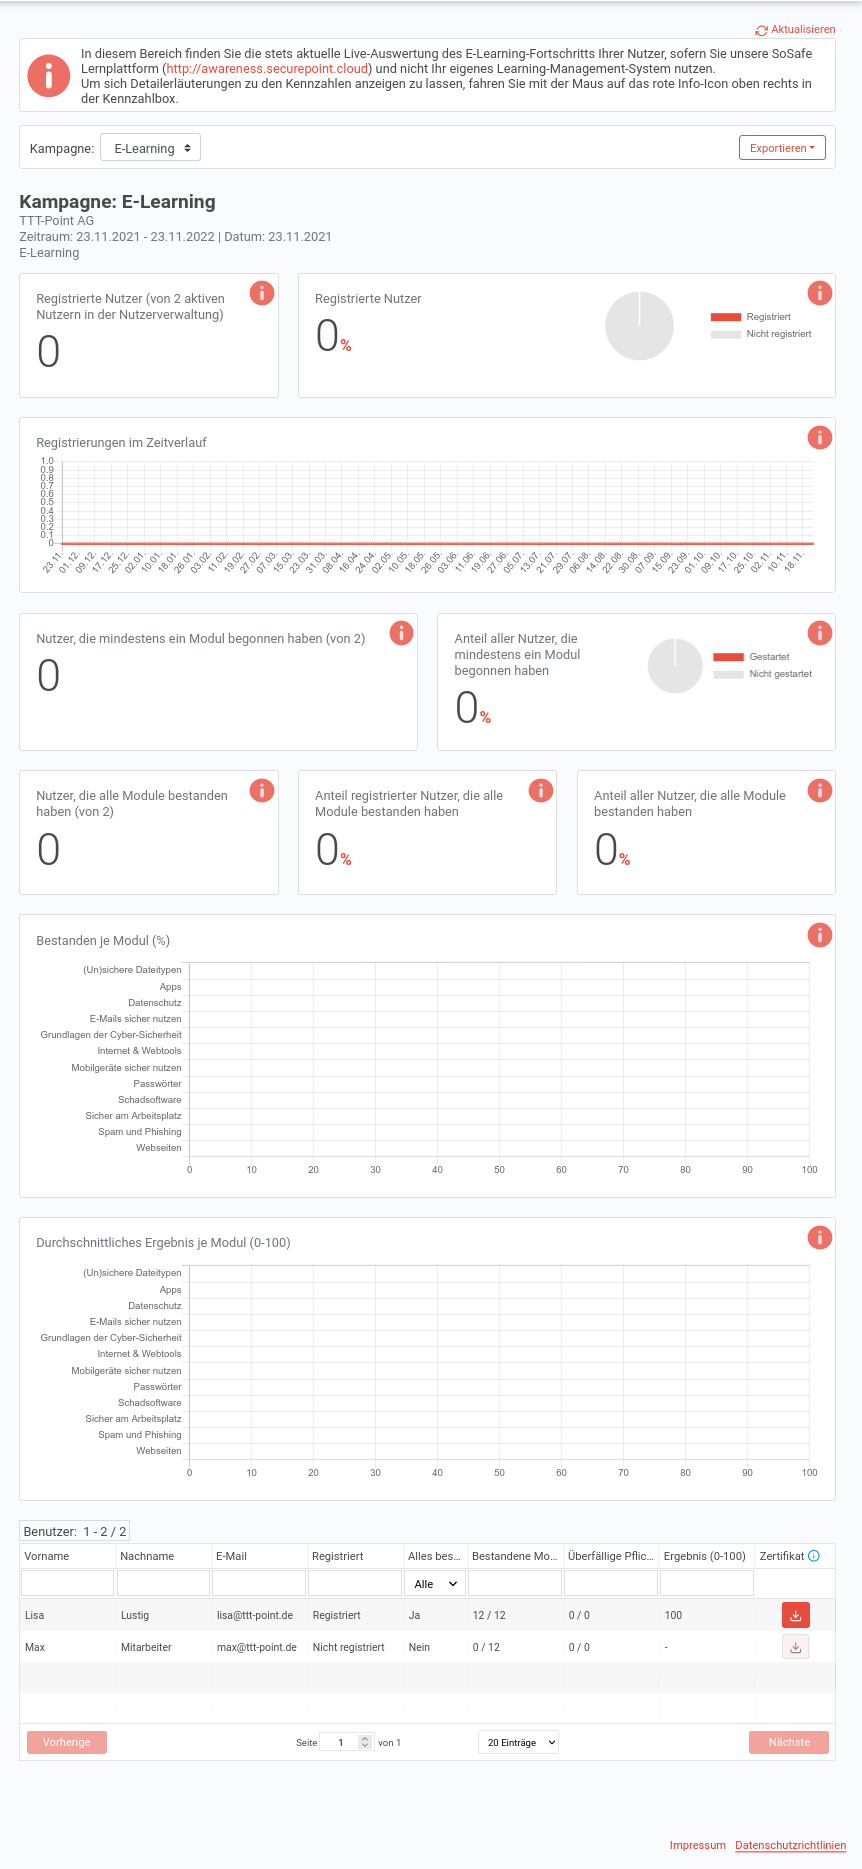
E-Learning
This area contains the live evaluation of the e-learning progress of the users.
To view detailed explanations of the key figures, please move your mouse over the red info icon at the top right of the key figure box.
| Tile title |
Description
|

|
| Registered users |
Number of already registered users with comparison to the number of all potential users (indicated in parentheses)
|
| Registered users in % |
Proportion of already registered users in relation to the total number of potential users
|
| Registrations over time: |
Number of registrations over time
|
| Users who have started at least one module: |
Number of users who have already started e-learning, with comparison to the number of all potential users (shown here in parentheses)
|
| Percentage of registered users who have started at least one module: |
Number of users who have already started e-learning in relation to the total number of potential users
|
| Users who have completed all modules: |
Number of users who have already passed all modules
|
| Percentage of registered users who have completed all modules: |
Proportion of users who have already passed all modules in relation to the total number of all users already registered
|
| Percentage of all users who have completed all modules: |
Proportion of users who have already passed all modules in relation to the total number of all potential users
|
| Completed per module (%): |
Proportion of users who have already passed the respective module in relation to the total number of all users who have already registered
|
| Average Result per module (0-100): |
After completing a module, each user achieves a score between zero and 100. The value displayed here is the arithmetic mean of the results achieved by the users in this module.
|
|
|
User  |
A certificate can be downloaded for each employee upon completion of all mandatory modules.Only available if in the configuration of the E-Learning in the section Options the Personal Tracking has been activated.
|
|
|

