Unified Security Console overview dashboard
New article with version: 1.21
notempty
This article refers to a Resellerpreview
Introduction
The dashboard provides an overview of the current status of the existing UTMs.
For resellers, there is a dashboard view of all their clients.
All clients
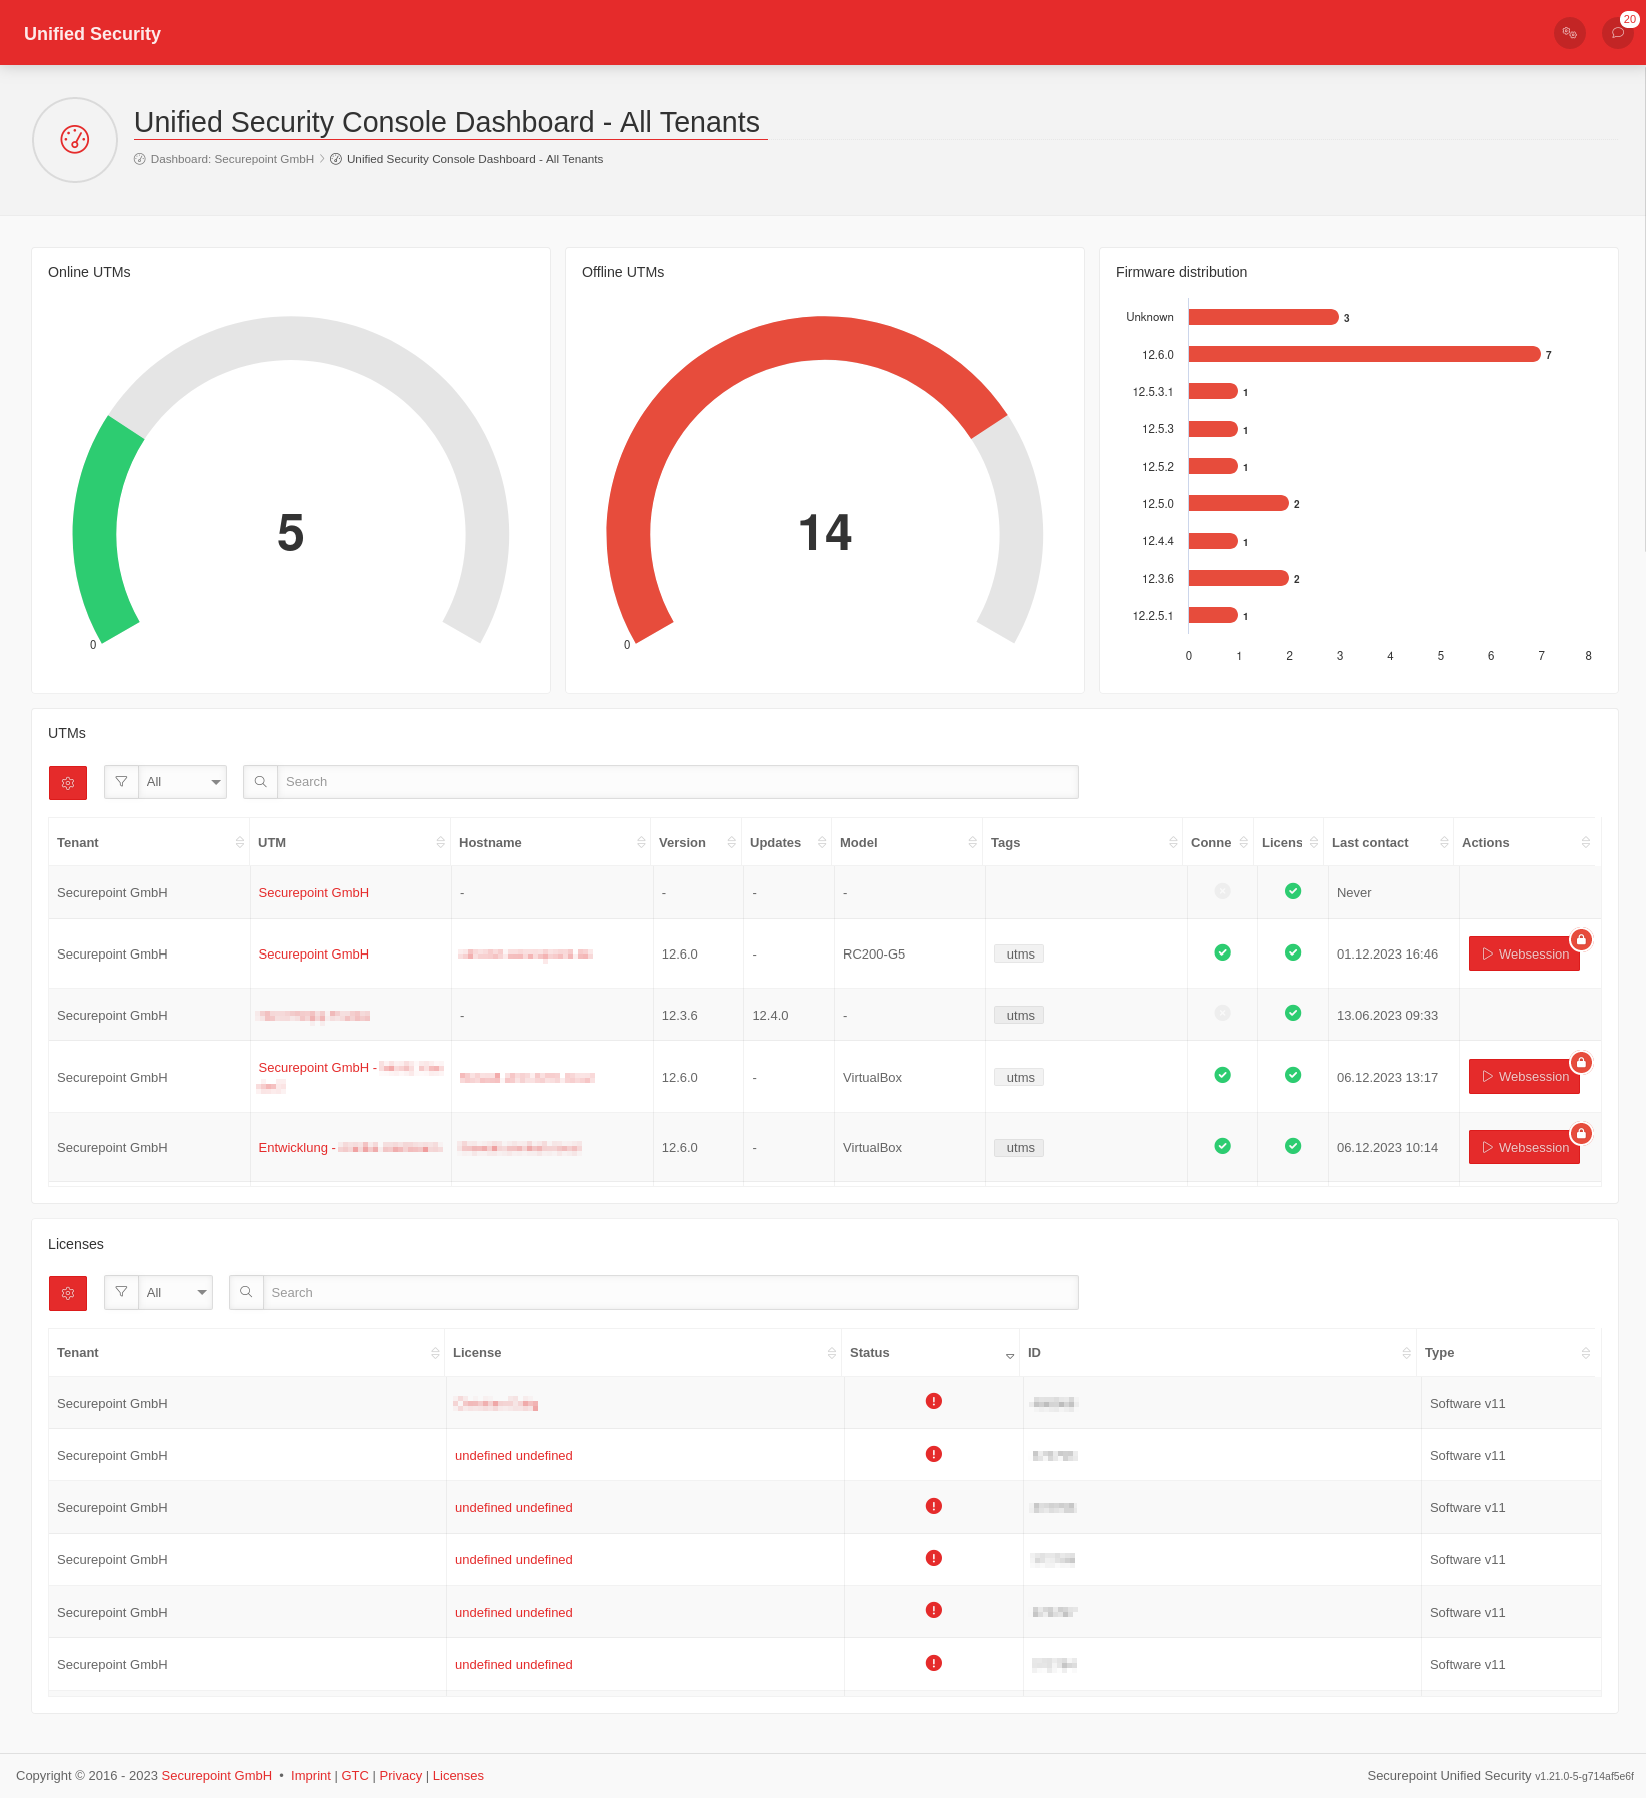
| To access the dashboard view of all clients, log in to the portal as a reseller. Select the reseller client Anyideas in the upper left selection button. The dashboard for all clients is then displayed under . |
 | |
Device overview | ||
| An overview of the number of UTMs, which are online and which are offline across all clients. | ||
Firmware distribution | ||
| An overview of the firmware distribution of the UTMs of all clients is also displayed. | ||
UTMs | ||
| The established UTMs of all clients under with their device information and status are displayed. | ||
| Options | Shows the tags that are displayed in the UTM table. Per Default active are Client, UTM, Hostname, Version, Updates, Model, Tags, Connected, License, Last contact and Actions. | |
| The search filter can be selected. Other filters are the tags mentioned above. | ||
| The search runs automatically when an entry is made. | ||
Actions | ||
| In the Actions column, a web session can be started for an active, connected UTM. To do this, click on the Websession button. The icon { describes that access to the web session requires a login. | ||
Licenses | ||
The licenses set up under are displayed with the following details:
| ||
| Options | Shows the tags that are displayed in the license table. Per default active all details are active. | |
| The search filter can be selected Other filters are the tags mentioned above | ||
| The search runs automatically when an entry is made | ||
My Unified Security Console
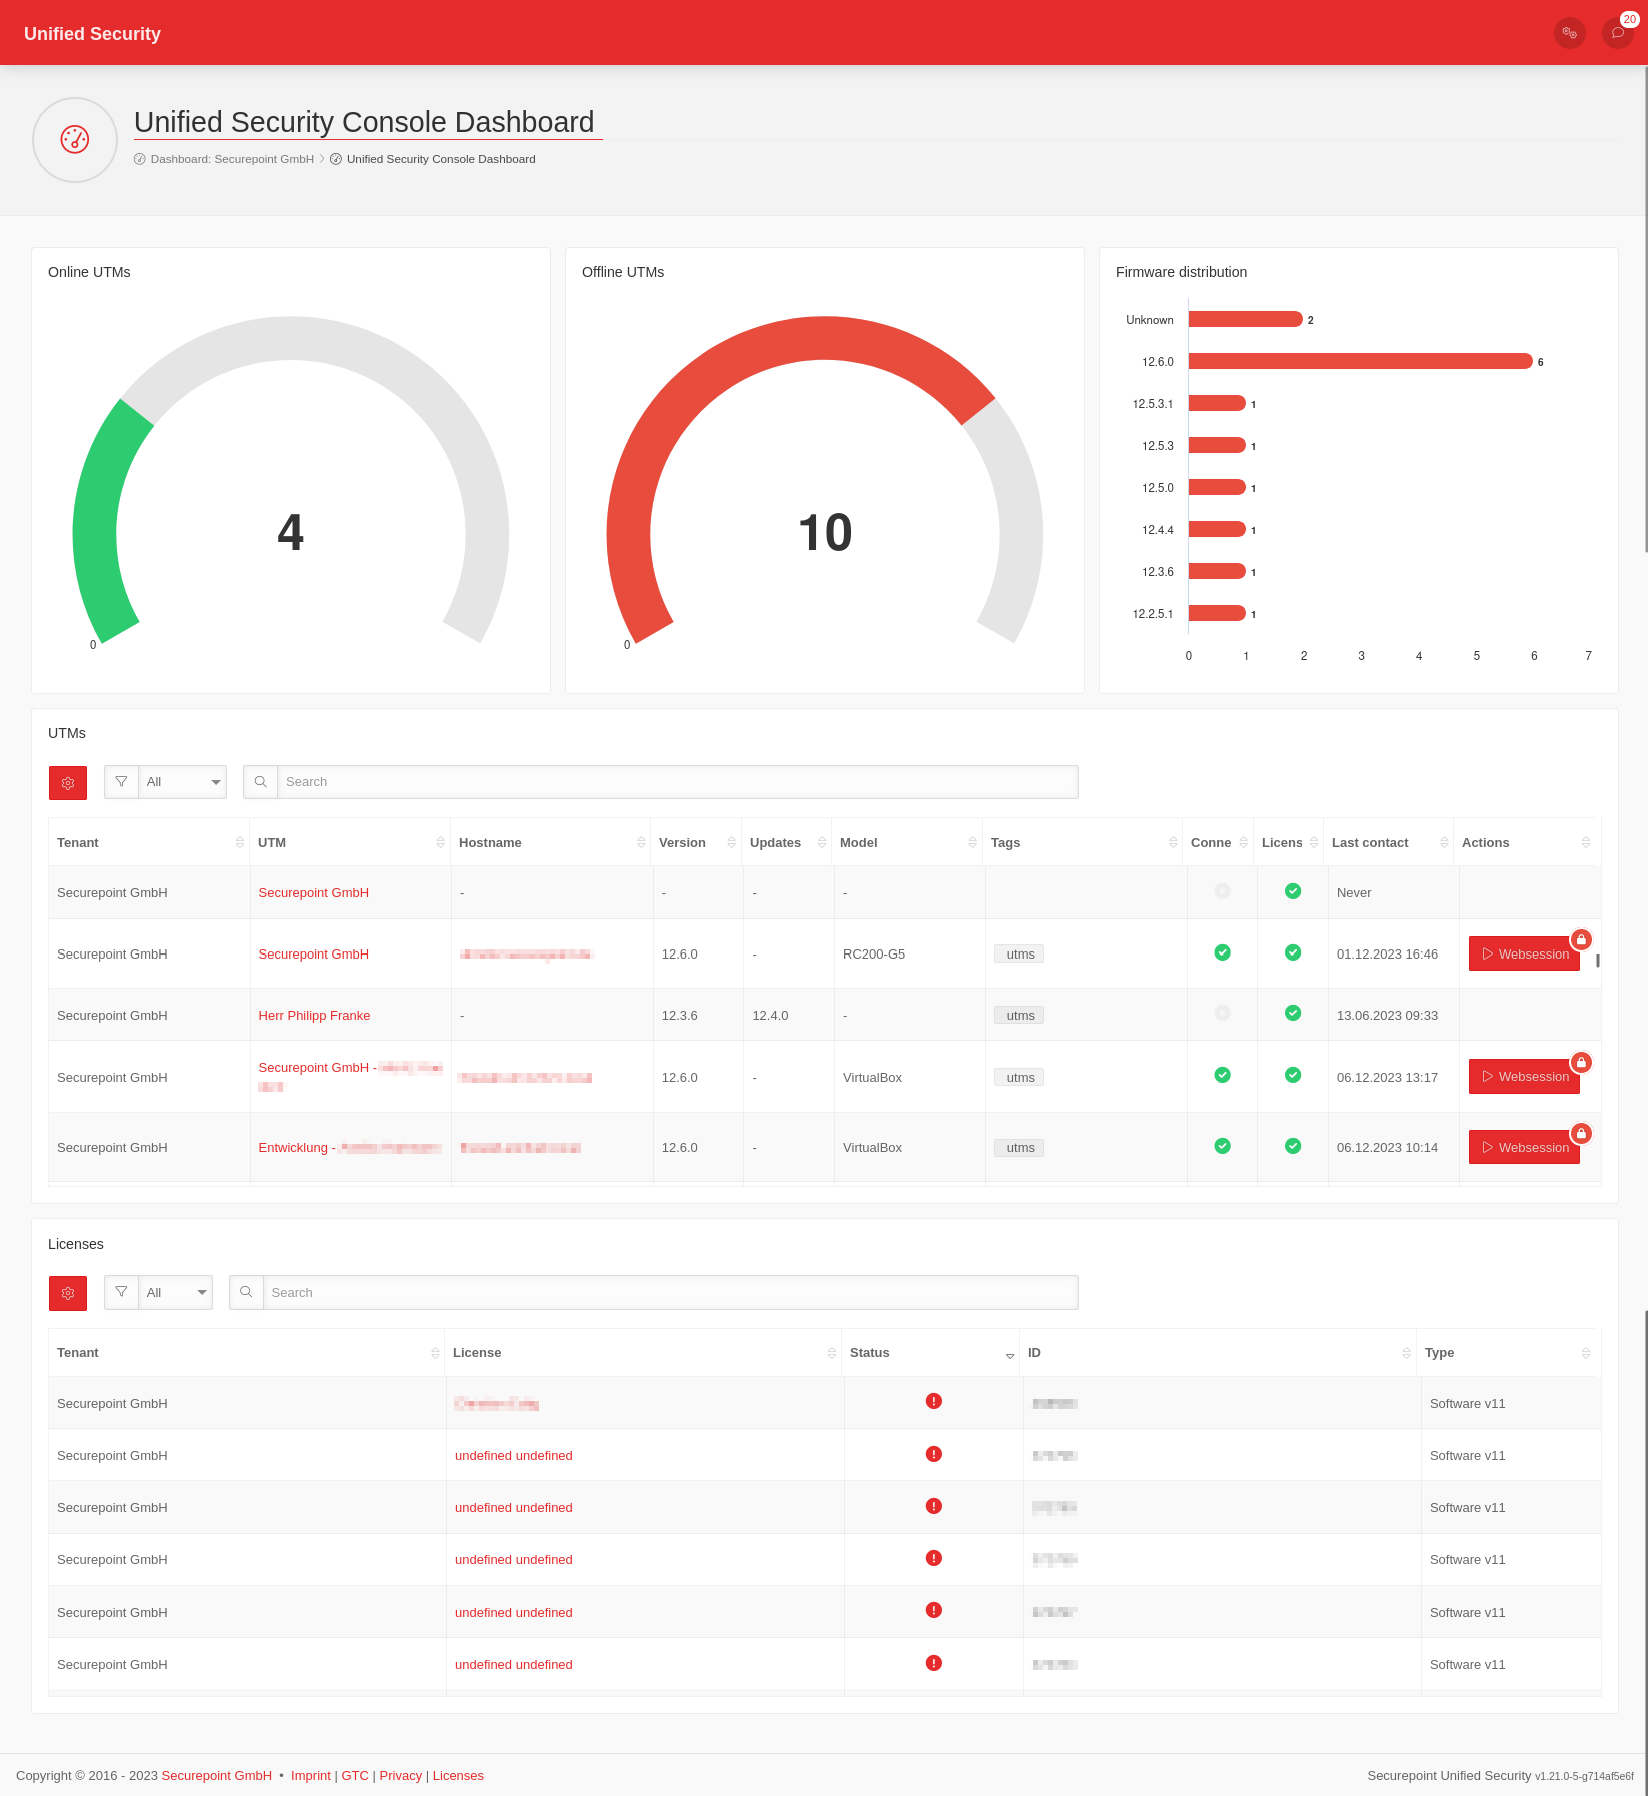
| To access the dashboard view of your own client, log in to the portal. Select the client TTT-Point from the top left selection button. The client's dashboard is then displayed under . |
 | |
Device overview | ||
| An overview of the number of UTMs, which are online and which are offline. | ||
Firmware distribution | ||
| An overview of the firmware distribution of the UTMs is also displayed. | ||
UTMs | ||
| The UTMs set up under with their device information and status are displayed. | ||
| Options | Shows the tags that are displayed in the UTM table. Per Default active are Client, UTM, Hostname, Version, Updates, Model, Tags, Connected, License, Last contact and Actions. | |
| The search filter can be selected. Other filters are the tags mentioned above. | ||
| The search runs automatically when an entry is made. | ||
Actions | ||
| In the Actions column, a web session can be started for an active, connected UTM. To do this, click on the Websession button. The icon { describes that access to the web session requires a login. | ||
Licenses | ||
The licenses set up under are displayed with the following details:
| ||
| Options | Shows the tags that are displayed in the license table. Per default active all details are active. | |
| The search filter can be selected Other filters are the tags mentioned above | ||
| The search runs automatically when an entry is made | ||