In dieser Seite werden die Variablen für unterschiedliche Sprachen definiert.
Diese Seite wird auf folgenden Seiten eingebunden
| USC v2.3 Cloud Shield Statistiken Top erlaubte Domains-en.png }}
| USC v2.3 Cloud Shield Statistiken Top blockierte Domains-en.png }}
| USC v2.3 Cloud Shield Statistiken Top Blockierungsgruende-en.png }}
| USC v2.3 Cloud Shield Statistiken Top Geraete-en.png }}
| USC v2.3 Cloud Shield Statistiken Top Anfragetypen-en.png }}
| USC v2.3 Cloud Shield Statistiken Top Profile-en.png }}
| USC v2.3 Cloud Shield Statistiken Traffic-Map-en.png }}
Explanation of the statistics of the Securepoint Cloud Shield
New with Securepoint | Version: 2.3.13 (04.2025)
notemptyThis article refers to a Beta version
-
Statistics
| General statistics, web behavior of devices with Cloud ShieldMore information is displayed for all diagrams by hovering over the data
|
| Button |
Description
|
| Today |
Period to be included in the displayed statistics
|
Complete domains
Root domains |
Viewing the entire domain or just the root domain for the statistics
|
linear
Logarithmic |
High axis labeling Linear or logarithmic
|
| 30 Seconds |
Interval to automatically update statistics
|
| update |
Update statistics manually
|
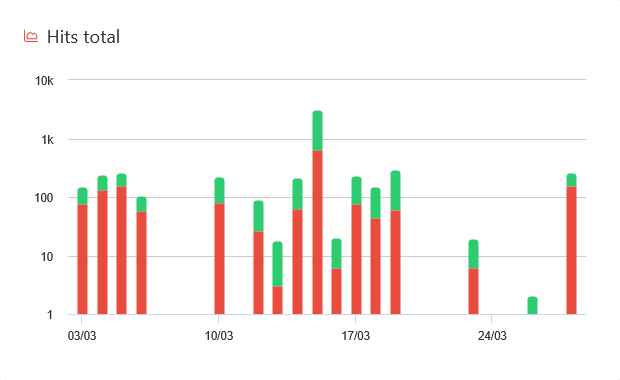
Total inquiries
Number of all requests from all devices in the form of a bar chart with a distinction between permitted (green) and blocked (red) requests.
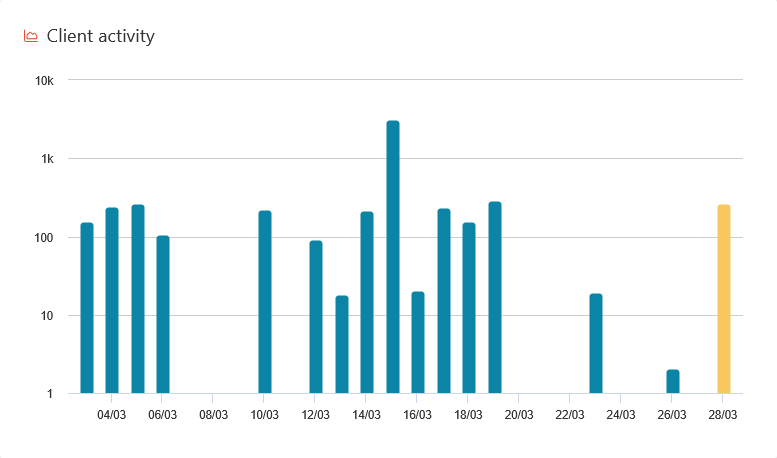
Device activity
Activities of the individual devices in a column-layer digram
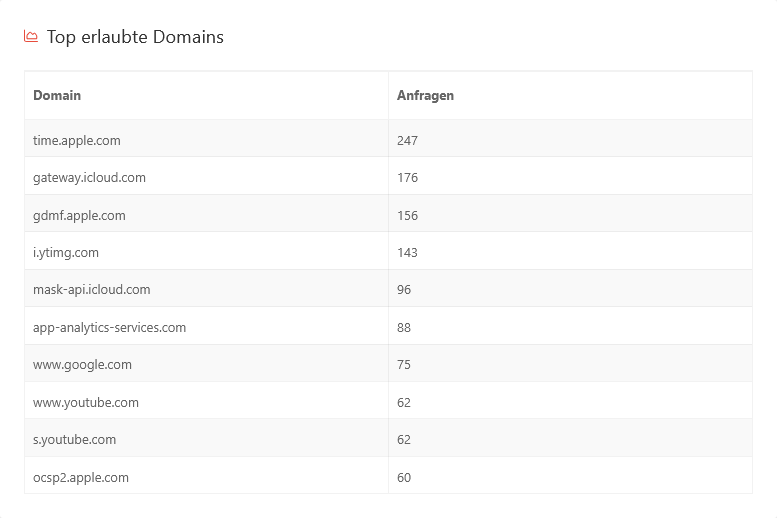
Top allowed domains
Top 10 most visited domains
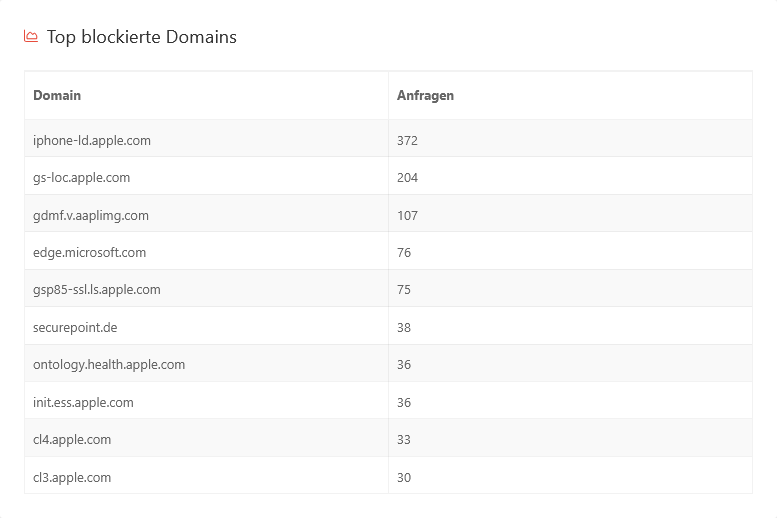
Top blocked domains
Top 10 most blocked domains (by call attempts)
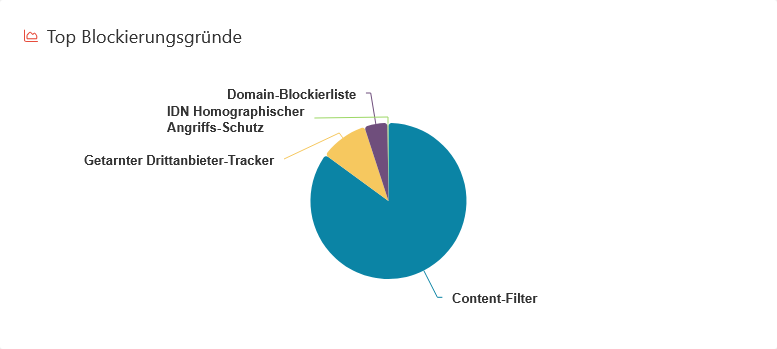
Top blocking reasons
Pie chart on the reasons for blocking (content filter, domain blocklist, disguised third-party trackers)
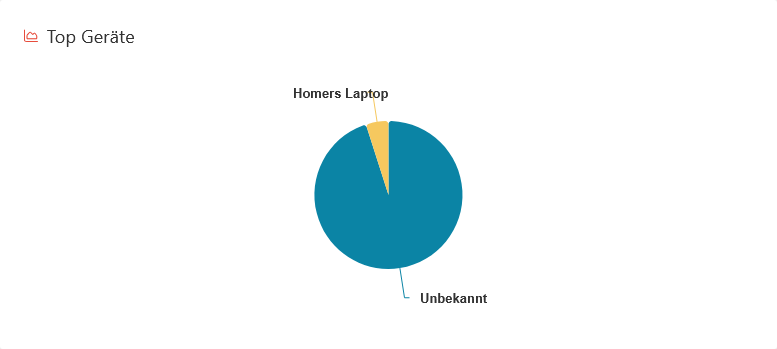
Top devices
Top devices, according to most sent requests

Top request types
Pie chart with the different request types and their shares. Additional information is displayed by hovering over the shares.
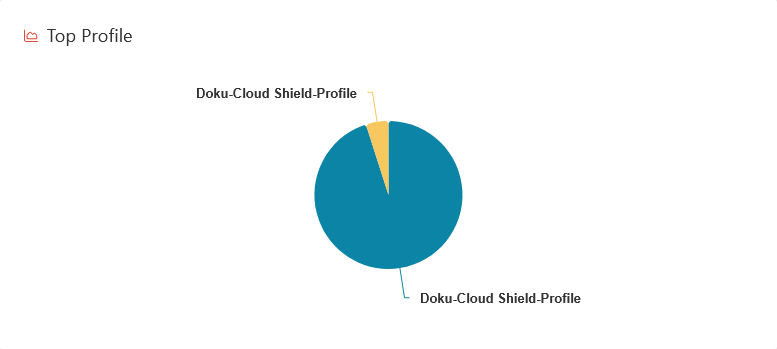
Top profiles
Pie chart showing the number of requests by different profiles
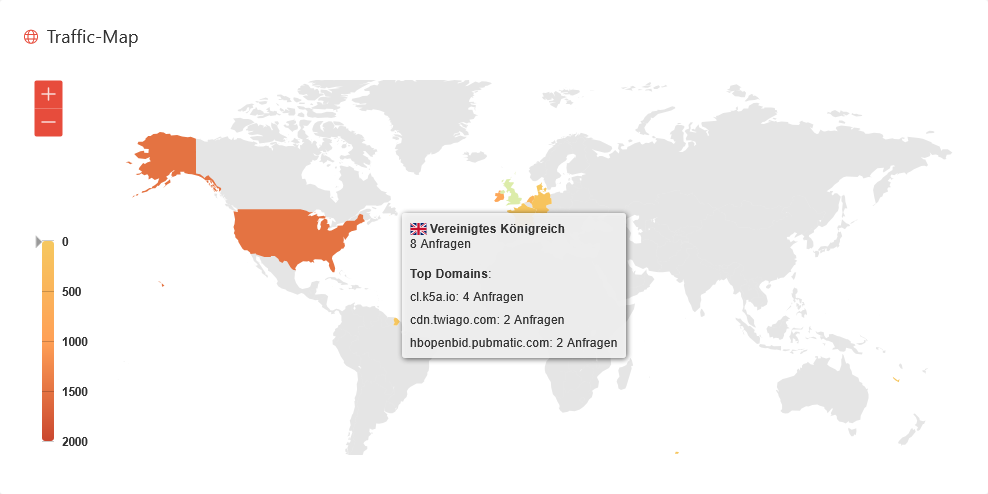
Traffic map
Traffic map to the destinations of the requests. More information is displayed by hovering over a country.