


Functions in the UTM dashboard
Last adaptation to the version: 14.1.1 (11.2025)
New:
notempty
This article refers to a Beta version
Introduction
- On the dashboard, the Widgets can be found; these provide a custom overview of the current UTM status.
- Using the button in the top-right header, you can view the Alert messages (further information can be found in the AlertingCenter article).
- At the bottom left, the toolbar is located; it offers tools for adjusting the interface style.
Widgets
General
UTMuser@firewall.name.fqdn 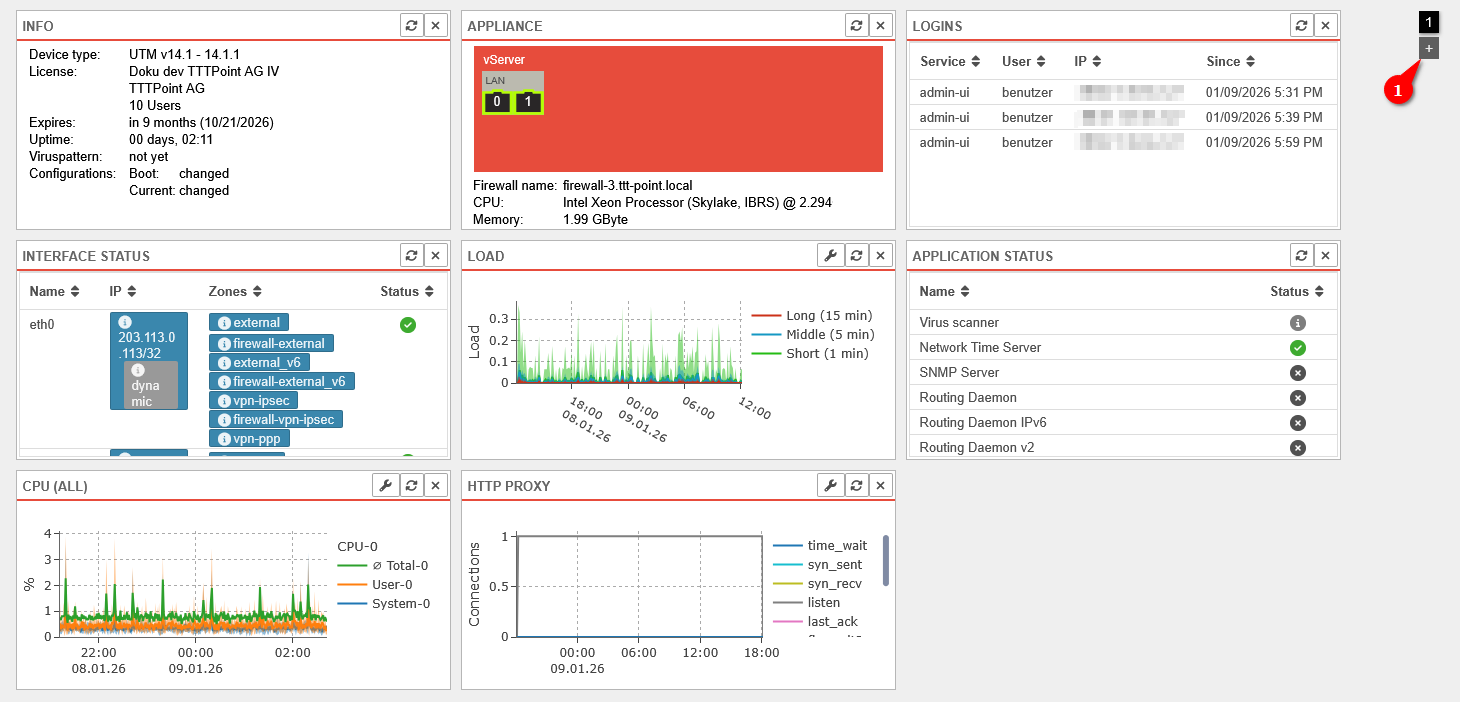

Dashboard
- Various widgets can be placed on the dashboard of the UTM
- An overview of the widget selection can be opened via the button
- The widgets can be added to the dashboard with a click
- Additional dashboard pages can be created using the button at the top right (1)
- Use the numbered buttons at the top right (1) to switch between the dashboard pages
Default Widgets
| Icon | Item | Value | Description | |
|---|---|---|---|---|
| Default Widget | The following basic information about the UTM is displayed here:
|
 Info-Widget
| ||
ApplianceDefault Widget |
0 | Active port with port number |   Extended Appliance Widget Extended Appliance Widget
| |
| Additional information is shown when hovering above:Interface: LAN1 Slot:LAN Status: UP MAC address: 52:54:00:56:AB:89 | ||||
| 3 | Inactive port | |||
Schematic view (arrangement as on the device)  Enumerative view  Illustration of the device with expansion cards, if necessary |
Switches between the views schematic, enumerative and illustration (if available) | |||
The widget can be dragged in order to get bigger | ||||
LoginsDefault Widget |
Display of currently logged in users with:
|
 Login Widgets
| ||
Interface statusDefault Widget | ||||
| Name: | LAN1 | Name of the interface, corresponds with the port number |  | |
| IP: | 10.0.0.140/24Example IP | IP assigned to the interface | ||
| dynamic | Receiving an IP address via DHCP | |||
| offline | Interface is offline | |||
| virtual | Virtual IP adress | |||
| Zones: | external | Zones assigned to the interface | ||
| Status: | Link up or connection is established | |||
| Link down or connection interrupted | ||||
| Error in case of faulty interface configuration e.g. failed NIC | ||||
LoadDefault Widget |
Display of average values for the load of the last 60 seconds, 5 minutes and 15 minutes. Further notes on LOAD can be found in the FAQ. |
  Extended LOAD Widget Extended LOAD Widget
| ||
| Opens a dialog for further settings notempty
New as of v14.1.1 | ||||
| View type | Default display with timeline on the x-axis | |||
Shows only the values of the last record 
| ||||
| The following options appear in the title bar when hovering over the widget | ||||
| Zoom settings | Settings for zooming in, zooming out, and fully zooming out | |||
| Time settings | Settings to change the time period to the start of the recording, earlier or later than now, or to the most recent period | |||
| Reset | This resets the zoom and time settings | |||
Application StarterDefault Widget |
Displays the status of applications. Further notes can be found in a separate Wiki article. |  Application Status Widget
| ||
| Status: | The service is started and working | |||
| The service is not available on this appliance | ||||
| The service is started but faulty | ||||
| The service is stopped | ||||
CPUDefault Widget |
Displays the CPU utilization graphically and by time notempty
Changed to 12.7.1 The values on the y-axis are in per cent."600 m" (for 600 millipercent) is now displayed as "0.6". 10 means 10% CPU utilisation. |
  Extended CPU Widget Extended CPU Widget
| ||
| Opens a dialog for further settings notempty
New as of v14.1.1 | ||||
| View type | Default display with timeline on the x-axis | |||
Shows only the values of the last record  | ||||
| Entries | CPU-0 CPU-1 (Default: No selection) | Selection of the elements whose values should be displayed in the widget Clicking the checkbox opens a selection dropdown menu If no elements are selected, the values of all elements are displayed. | ||
| The following options appear in the title bar when hovering over the widget | ||||
| Zoom settings | Settings for zooming in, zooming out, and fully zooming out | |||
| Time settings | Settings to change the time period to the start of the recording, earlier or later than now, or to the most recent period | |||
| Reset | This resets the zoom and time settings | |||
Optional Widgets | ||||
| Optional widgets can be added via the button in the header or removed again via the button of the widget. | ||||
IPS | ||||
| Service: | sshd | Type of connection that is banned |  | |
| IP: | 192.168.0.42 | IP address of the connection that is banned | ||
| Remaining ban time (sec.): | 3378 | The remaining duration of the ban in seconds | ||
InterfacesDefault Widget |
Graphical representation of network traffic on selected interfaces, divided into average total traffic, sent data, and received data |  Interfaces Widget
| ||
| Opens a dialog for further settings notempty
New as of v14.1.1 | ||||
| View type | Default display with timeline on the x-axis | |||
Shows only the values of the last record  Hover for details per record | ||||
| Entries | LAN2 LAN3 (Default: No selection) | Selection of the elements whose values should be displayed in the widget Clicking the checkbox opens a selection dropdown menu If no elements are selected, the values of all elements are displayed. | ||
WireGuard |
 The WireGuard widget over 2 columns or more provides additional information
|
 | ||
| Peer Name: | peer-b | Name as configured in the WireGuard menu | ||
| Allowed IPs: | 10.2.0.0/16 | IP addresses allowed for the remote site's local networks. (For Roadwarrior: The tunnel IP). | ||
| Endpoint: | b.vpn.anyideas.de:51820 | Public IP with port number or in the public DNS resolvable FQDN of the remote terminal (if available). | ||
| Last handshake: | a few seconds ago | |||
| Receive Sent: |
85.1kb | Received or sent data volume | ||
| Keepalive: | 25 seconds | Set value for the keepalive signal | ||
| Interface: | wg0 | Used (virtual) WireGuard interface | ||
| Status: | The WireGuard tunnel is active. (Firewall rules are needed for the remote hosts!)
| |||
| An error has occurred. The connection cannot be established. | ||||
| No indication of status can be made until a data packet is transmitted or the keepalive is activated. The connection status of peers for which no endpoint is defined is basically only updated on incoming traffic/keepalive from the client side, i.e. an unknown status in this case does not necessarily mean a misconfiguration, but only an inactive client, if applicable. | ||||
DHCP | ||||
notempty
Removed with v14: The DHCP information can now be found under . | ||||
| Displays temperature of the CPU | ||||
Displays memory utilization graphically and over time. The categories are:
|
 Memory-Widget
| |||
| Displays disk space usage graphically and by time |  Data Disk-Widget
| |||
| Displays the temperature of the hard disk | ||||
| Displays IPSEC connections to the UTM with name, local subnet, remote subnet, and status |  IPSEC-Widget
| |||
SSL-VPN |
Shows SSL-VPN connections to the UTM |  SSL-VPN-Widget
| ||
| Name | RW-TTT-Point | Name of the SSL-VPN connection | ||
| Time | 01/09/2026 3:52 PM | Date and time of the last connection | ||
| Address | IP-Address | IP address of the client | ||
| Tunnel | 192.168.193.1 | VPN tunnel being used | ||
| Status | Connection status | |||
| Shows other devices in the IP networks with IP address, MAC address, and status. |  Neighbors-Widget
| |||
| Displays information about the WiFi function of the UTM | ||||
| Shows the mail filter history and the percentage of emails that were discarded, quarantined, rejected, or accepted |   Extended Mail Filter Widget Extended Mail Filter Widget
| |||
| The following options appear in the title bar when hovering over the widget | ||||
| Zoom settings | Settings for zooming in, zooming out, and fully zooming out | |||
| Time settings | Settings to change the time period to the start of the recording, earlier or later than now, or to the most recent period | |||
| Reset | This resets the zoom and time settings | |||
| Displays the mobile function of the UTM | ||||
| Shows the reverse proxy history based on the following TCP states |   Extended Reverse Proxy Widget Extended Reverse Proxy Widget
| |||
|
| |||
| The following options appear in the title bar when hovering over the widget | ||||
| Zoom settings | Settings for zooming in, zooming out, and fully zooming out | |||
| Time settings | Settings to change the time period to the start of the recording, earlier or later than now, or to the most recent period | |||
| Reset | This resets the zoom and time settings | |||
| Shows the POP3 proxy history |   Extended POP3 Proxy Widget Extended POP3 Proxy Widget
| |||
|
| |||
| The following options appear in the title bar when hovering over the widget | ||||
| Zoom settings | Settings for zooming in, zooming out, and fully zooming out | |||
| Time settings | Settings to change the time period to the start of the recording, earlier or later than now, or to the most recent period | |||
| Reset | This resets the zoom and time settings | |||
| Shows the HTTP proxy history |   Extended HTTP Proxy Widget Extended HTTP Proxy Widget
| |||
|
| |||
| The following options appear in the title bar when hovering over the widget | ||||
| Zoom settings | Settings for zooming in, zooming out, and fully zooming out | |||
| Time settings | Settings to change the time period to the start of the recording, earlier or later than now, or to the most recent period | |||
| Reset | This resets the zoom and time settings | |||
| Shows the mail relay history based on the following TCP states |   Extended Mail Relay Widget Extended Mail Relay Widget
| |||
|
| |||
| The following options appear in the title bar when hovering over the widget | ||||
| Zoom settings | Settings for zooming in, zooming out, and fully zooming out | |||
| Time settings | Settings to change the time period to the start of the recording, earlier or later than now, or to the most recent period | |||
| Reset | This resets the zoom and time settings | |||
| Exists for each interface, shows the interface history graphically and based on time (here for the interface: LAN1) |  Interface-Widget
| |||
toolbar
| The toolbar is located at the bottom left, at the end of the menu bar | |||
| Icon | Caption | Description | [[Datei: ]] The toolbar is located at the bottom left,
at the end of the menu bar |
|---|---|---|---|
| / notempty
New as of v12.6.1 |
Light / Dark Mode | This button can be used to switch between light and dark mode. | |
| / | Icons for easier differentiation | When this function is activated, status displays contain icons to make them easier to distinguish Switched on: | |
| Only in the admin interface | Configure table display | Opens the configuration dialog for table display | |
| Only in the admin interface notempty Call postponed |
Network tools | Opens the network tools (for more information see here) | |
| Configuration dialog for table display: | |||
| Style: | General display style (Classic: Horizontal listing) Below you will find Sample displays of the styles |
 Configuration dialog for table display
| |
| Entries per page: | |||
| Maximum height: | Adjust table height to the browser window size | ||
| Adjust table height to a predefined size (old default) | |||
| Adjust table height to the content so that the entire content is shown | |||
| Delete table-specific settings: | Yes | Activates the overwriting of settings that have been made in the respective table with the settings (). | |
Sample illustrations for the different styles:

Style:

Style:

Style: