notempty Dieser Artikel bezieht sich auf eine nicht mehr aktuelle Version!
notempty Der Artikel für die neueste Version steht hier
notempty Zu diesem Artikel gibt es bereits eine neuere Version, die sich allerdings auf eine Beta-Version bezieht
New article with version: 14.0 (11.2024)
notemptyThis article refers to a Beta version
Introduction
- On the dashboard, the Widgets can be found; these provide a custom overview of the current UTM status.
- Using the button in the top-right header, you can view the Alert messages (further information can be found in the AlertingCenter article).
- At the bottom left, the toolbar is located; it offers tools for adjusting the interface style.
Widgets
notempty This article refers to a version that is no longer current!
notempty The article for the latest version is here
notempty There is already a newer version of this article, but it refers to a Beta version
General
UTMuser@firewall.name.fqdn  Dashboard
- Various widgets can be placed on the dashboard of the UTM
- An overview of the widget selection can be opened via the button
- The widgets can be added to the dashboard with a click
- Additional dashboard pages can be created using the button at the top right (1)
- Use the numbered buttons at the top right (1) to switch between the dashboard pages
Default Widgets
Default widgets are already created for each user. They can be subsequently removed and added again
| Icon | Item | Value | Description | General information (Info)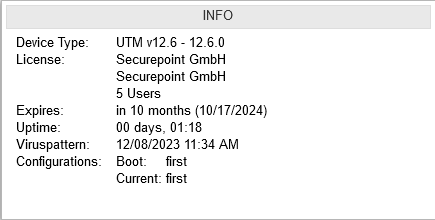 |
|---|---|---|---|---|
| Default Widget | ||||
ApplianceDefault Widget |
0 | Active port with port number | 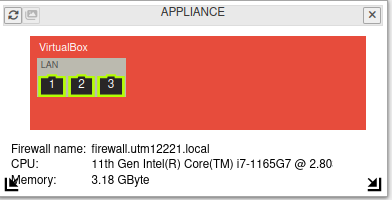 | |
| Additional information is shown when hovering above:Interface: LAN1 Slot:LAN Status: UP MAC address: 52:54:00:56:AB:89 | ||||
| 3 | Inactive port | |||
|
Switches between the views schematic, enumerative and illustration (if available) | |||
| The widget can be dragged in order to get bigger | ||||
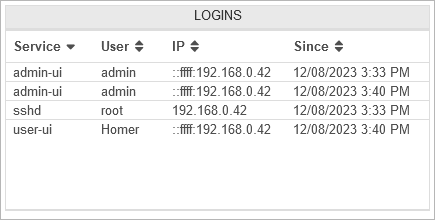
LoginsDefault Widget |
Display of currently logged in users with:
|
 | ||
InterfacesDefault Widget | ||||
| Name: | LAN1 | Name of the interface, corresponds with the port number | 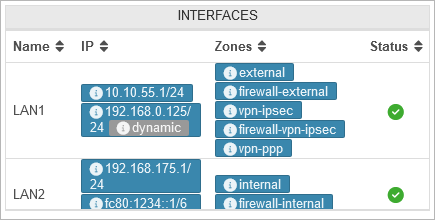 | |
| IP: | 10.0.0.140/24Example IP | IP assigned to the interface | ||
| dynamic | Receiving an IP address via DHCP | |||
| offline | Interface is offline | |||
| virtual | Virtual IP adress | |||
| Zones: | external | Zones assigned to the interface | ||
| Status: | Link up or connection is established | |||
| Link down or connection interrupted | ||||
| Error in case of faulty interface configuration e.g. failed NIC | ||||
LoadDefault Widget |
Display of average values for the load of the last 60 seconds, 5 minutes and 15 minutes. Further notes on LOAD can be found in the FAQ. |
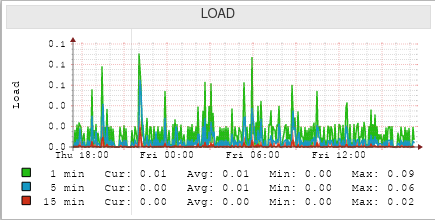 | ||
Application StarterDefault Widget |
Displays the status of applications. Further notes can be found in a separate Wiki article. | 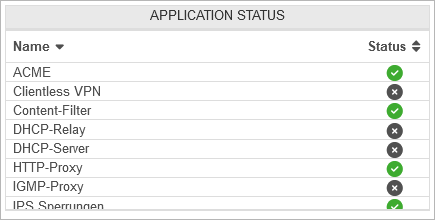 | ||
| Status: | The service is started and working | |||
| The service is not available on this appliance | ||||
| The service is started but faulty | ||||
| The service is stopped | ||||
CPU-0Default Widget |
Displays CPU utilization graphically and by time notemptyChanged to 12.7.1The values on the y-axis are in per cent. "600 m" (for 600 millipercent) is now displayed as "0.6". 10 means 10% CPU utilisation. |
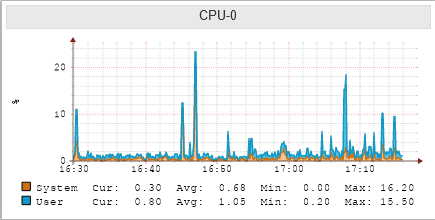 | ||
Optional Widgets | ||||
| Optional widgets can be added via the button in the header or removed again via the button of the widget. | ||||
IPS | ||||
| Service: | sshd | Type of connection that is banned | 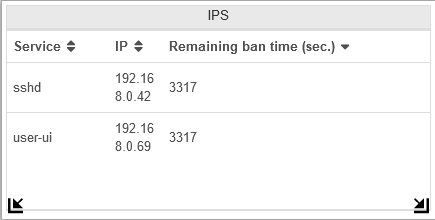 | |
| IP: | 192.168.0.42 | IP address of the connection that is banned | ||
| Remaining banishing time (sec.): | 3378 | The remaining duration of the ban in seconds | ||
WireGuard |
 |
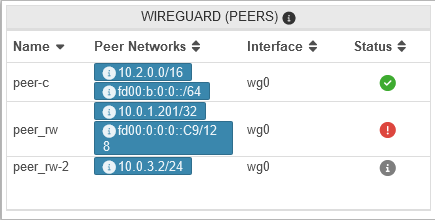 | ||
| Peer Name: | peer-b | Name as configured in the WireGuard menu | ||
| Allowed IPs: | 10.2.0.0/16 | IP addresses allowed for the remote site's local networks. (For Roadwarrior: The tunnel IP). | ||
| Endpoint: | b.vpn.anyideas.de:51820 | Public IP with port number or in the public DNS resolvable FQDN of the remote terminal (if available). | ||
| Last handshake: | a few seconds ago | |||
| Receive Sent: |
85.1kb | Received or sent data volume | ||
| Keepalive: | 25 seconds | Set value for the keepalive signal | ||
| Interface: | wg0 | Used (virtual) WireGuard interface | ||
| Status: | The WireGuard tunnel is active. (Firewall rules are needed for the remote hosts!
| |||
| An error has occurred. The connection cannot be established. | ||||
| No indication of status can be made until a data packet is transmitted or the keepalive is activated. The connection status of peers for which no endpoint is defined is basically only updated on incoming traffic/keepalive from the client side, i.e. an unknown status in this case does not necessarily mean a misconfiguration, but only an inactive client, if applicable. | ||||
DHCP | ||||
| notemptyRemoved with v14: The DHCP information can now be found under . | ||||
toolbar
| The toolbar is located at the bottom left, at the end of the menu bar | |||
| Icon | Caption | Description |  at the end of the menu bar |
|---|---|---|---|
| / notemptyNew as of v12.6.1 | Light / Dark Mode | This button can be used to switch between light and dark mode. | |
| / | Icons for easier differentiation | When this function is activated, status displays contain icons to make them easier to distinguish Switched on: | |
| Only in the admin interface | Configure table display | Opens the configuration dialog for table display | |
| Only in the admin interfacenotemptyCall postponed | Network tools | Opens the network tools (for more information see here) | |
| Configuration dialog for table display: | |||
| Style: | General display style (Classic: Horizontal listing) Below you will find Sample displays of the styles |
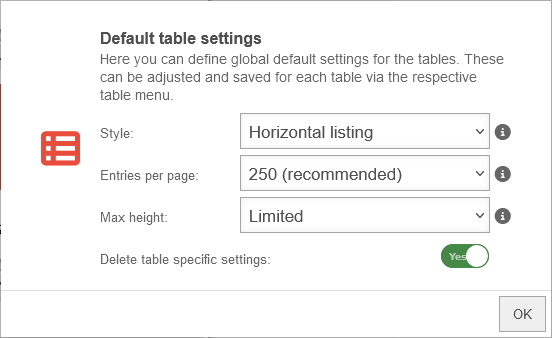 | |
| Entries per page: | |||
| Maximum height: | Adjust table height to the browser window size | ||
| Adjust table height to a predefined size (old default) | |||
| Adjust table height to the content so that the entire content is shown | |||
| Delete table-specific settings: | Yes | Activates the overwriting of settings that have been made in the respective table with the settings (). | |


