


Widgets for the UTM interface
Last adaptation to the version: 14.1.1 (11.2025)
New:
- Redesign of widgets and description of hover options for some widgets h
- There is now only one widget for the CPU.
In the widget settings, you can select which CPU (one, several, all) should be displayed.
The widget can be placed multiple times. - There is now only one widget for the interfaces.
In the widget settings, you can select which interface (one, several, all) should be displayed.
The widget can be placed multiple times.
- DHCP Widget removed
notempty
This article refers to a Beta version
General
UTMuser@firewall.name.fqdn 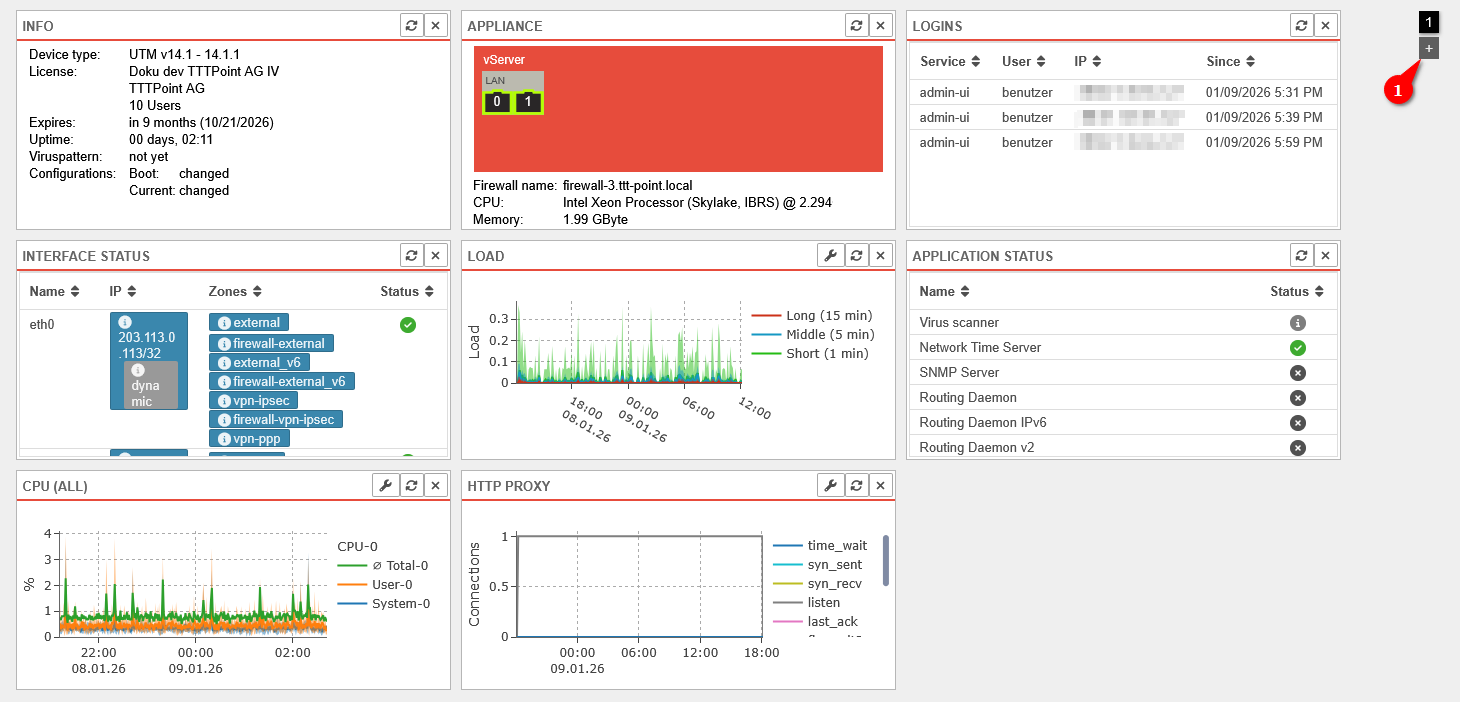

Dashboard
- Various widgets can be placed on the dashboard of the UTM
- An overview of the widget selection can be opened via the button
- The widgets can be added to the dashboard with a click
- Additional dashboard pages can be created using the button at the top right (1)
- Use the numbered buttons at the top right (1) to switch between the dashboard pages
Default Widgets
| Icon | Item | Value | Description | |
|---|---|---|---|---|
| Default Widget | The following basic information about the UTM is displayed here:
|
 Info-Widget
| ||
ApplianceDefault Widget |
0 | Active port with port number |   Extended Appliance Widget Extended Appliance Widget
| |
| Additional information is shown when hovering above:Interface: LAN1 Slot:LAN Status: UP MAC address: 52:54:00:56:AB:89 | ||||
| 3 | Inactive port | |||
Schematic view (arrangement as on the device)  Enumerative view  Illustration of the device with expansion cards, if necessary |
Switches between the views schematic, enumerative and illustration (if available) | |||
The widget can be dragged in order to get bigger | ||||
LoginsDefault Widget |
Display of currently logged in users with:
|
 Login Widgets
| ||
Interface statusDefault Widget | ||||
| Name: | LAN1 | Name of the interface, corresponds with the port number |  | |
| IP: | 10.0.0.140/24Example IP | IP assigned to the interface | ||
| dynamic | Receiving an IP address via DHCP | |||
| offline | Interface is offline | |||
| virtual | Virtual IP adress | |||
| Zones: | external | Zones assigned to the interface | ||
| Status: | Link up or connection is established | |||
| Link down or connection interrupted | ||||
| Error in case of faulty interface configuration e.g. failed NIC | ||||
LoadDefault Widget |
Display of average values for the load of the last 60 seconds, 5 minutes and 15 minutes. Further notes on LOAD can be found in the FAQ. |
  Extended LOAD Widget Extended LOAD Widget
| ||
| Opens a dialog for further settings notempty
New as of v14.1.1 | ||||
| View type | Default display with timeline on the x-axis | |||
Shows only the values of the last record 
| ||||
| The following options appear in the title bar when hovering over the widget | ||||
| Zoom settings | Settings for zooming in, zooming out, and fully zooming out | |||
| Time settings | Settings to change the time period to the start of the recording, earlier or later than now, or to the most recent period | |||
| Reset | This resets the zoom and time settings | |||
Application StarterDefault Widget |
Displays the status of applications. Further notes can be found in a separate Wiki article. |  Application Status Widget
| ||
| Status: | The service is started and working | |||
| The service is not available on this appliance | ||||
| The service is started but faulty | ||||
| The service is stopped | ||||
CPUDefault Widget |
Displays the CPU utilization graphically and by time notempty
Changed to 12.7.1 The values on the y-axis are in per cent."600 m" (for 600 millipercent) is now displayed as "0.6". 10 means 10% CPU utilisation. |
  Extended CPU Widget Extended CPU Widget
| ||
| Opens a dialog for further settings notempty
New as of v14.1.1 | ||||
| View type | Default display with timeline on the x-axis | |||
Shows only the values of the last record  | ||||
| Entries | CPU-0 CPU-1 (Default: No selection) | Selection of the elements whose values should be displayed in the widget Clicking the checkbox opens a selection dropdown menu If no elements are selected, the values of all elements are displayed. | ||
| The following options appear in the title bar when hovering over the widget | ||||
| Zoom settings | Settings for zooming in, zooming out, and fully zooming out | |||
| Time settings | Settings to change the time period to the start of the recording, earlier or later than now, or to the most recent period | |||
| Reset | This resets the zoom and time settings | |||
Optional Widgets | ||||
| Optional widgets can be added via the button in the header or removed again via the button of the widget. | ||||
IPS | ||||
| Service: | sshd | Type of connection that is banned |  | |
| IP: | 192.168.0.42 | IP address of the connection that is banned | ||
| Remaining ban time (sec.): | 3378 | The remaining duration of the ban in seconds | ||
InterfacesDefault Widget |
Graphical representation of network traffic on selected interfaces, divided into average total traffic, sent data, and received data |  Interfaces Widget
| ||
| Opens a dialog for further settings notempty
New as of v14.1.1 | ||||
| View type | Default display with timeline on the x-axis | |||
Shows only the values of the last record  Hover for details per record | ||||
| Entries | LAN2 LAN3 (Default: No selection) | Selection of the elements whose values should be displayed in the widget Clicking the checkbox opens a selection dropdown menu If no elements are selected, the values of all elements are displayed. | ||
WireGuard |
 The WireGuard widget over 2 columns or more provides additional information
|
 | ||
| Peer Name: | peer-b | Name as configured in the WireGuard menu | ||
| Allowed IPs: | 10.2.0.0/16 | IP addresses allowed for the remote site's local networks. (For Roadwarrior: The tunnel IP). | ||
| Endpoint: | b.vpn.anyideas.de:51820 | Public IP with port number or in the public DNS resolvable FQDN of the remote terminal (if available). | ||
| Last handshake: | a few seconds ago | |||
| Receive Sent: |
85.1kb | Received or sent data volume | ||
| Keepalive: | 25 seconds | Set value for the keepalive signal | ||
| Interface: | wg0 | Used (virtual) WireGuard interface | ||
| Status: | The WireGuard tunnel is active. (Firewall rules are needed for the remote hosts!)
| |||
| An error has occurred. The connection cannot be established. | ||||
| No indication of status can be made until a data packet is transmitted or the keepalive is activated. The connection status of peers for which no endpoint is defined is basically only updated on incoming traffic/keepalive from the client side, i.e. an unknown status in this case does not necessarily mean a misconfiguration, but only an inactive client, if applicable. | ||||
DHCP | ||||
notempty
Removed with v14: The DHCP information can now be found under . | ||||
| Displays temperature of the CPU | ||||
Displays memory utilization graphically and over time. The categories are:
|
 Memory-Widget
| |||
| Displays disk space usage graphically and by time |  Data Disk-Widget
| |||
| Displays the temperature of the hard disk | ||||
| Displays IPSEC connections to the UTM with name, local subnet, remote subnet, and status |  IPSEC-Widget
| |||
SSL-VPN |
Shows SSL-VPN connections to the UTM |  SSL-VPN-Widget
| ||
| Name | RW-TTT-Point | Name of the SSL-VPN connection | ||
| Time | 01/09/2026 3:52 PM | Date and time of the last connection | ||
| Address | IP-Address | IP address of the client | ||
| Tunnel | 192.168.193.1 | VPN tunnel being used | ||
| Status | Connection status | |||
| Shows other devices in the IP networks with IP address, MAC address, and status. |  Neighbors-Widget
| |||
| Displays information about the WiFi function of the UTM | ||||
| Shows the mail filter history and the percentage of emails that were discarded, quarantined, rejected, or accepted |   Extended Mail Filter Widget Extended Mail Filter Widget
| |||
| The following options appear in the title bar when hovering over the widget | ||||
| Zoom settings | Settings for zooming in, zooming out, and fully zooming out | |||
| Time settings | Settings to change the time period to the start of the recording, earlier or later than now, or to the most recent period | |||
| Reset | This resets the zoom and time settings | |||
| Displays the mobile function of the UTM | ||||
| Shows the reverse proxy history based on the following TCP states |   Extended Reverse Proxy Widget Extended Reverse Proxy Widget
| |||
|
| |||
| The following options appear in the title bar when hovering over the widget | ||||
| Zoom settings | Settings for zooming in, zooming out, and fully zooming out | |||
| Time settings | Settings to change the time period to the start of the recording, earlier or later than now, or to the most recent period | |||
| Reset | This resets the zoom and time settings | |||
| Shows the POP3 proxy history |   Extended POP3 Proxy Widget Extended POP3 Proxy Widget
| |||
|
| |||
| The following options appear in the title bar when hovering over the widget | ||||
| Zoom settings | Settings for zooming in, zooming out, and fully zooming out | |||
| Time settings | Settings to change the time period to the start of the recording, earlier or later than now, or to the most recent period | |||
| Reset | This resets the zoom and time settings | |||
| Shows the HTTP proxy history |   Extended HTTP Proxy Widget Extended HTTP Proxy Widget
| |||
|
| |||
| The following options appear in the title bar when hovering over the widget | ||||
| Zoom settings | Settings for zooming in, zooming out, and fully zooming out | |||
| Time settings | Settings to change the time period to the start of the recording, earlier or later than now, or to the most recent period | |||
| Reset | This resets the zoom and time settings | |||
| Shows the mail relay history based on the following TCP states |   Extended Mail Relay Widget Extended Mail Relay Widget
| |||
|
| |||
| The following options appear in the title bar when hovering over the widget | ||||
| Zoom settings | Settings for zooming in, zooming out, and fully zooming out | |||
| Time settings | Settings to change the time period to the start of the recording, earlier or later than now, or to the most recent period | |||
| Reset | This resets the zoom and time settings | |||
| Exists for each interface, shows the interface history graphically and based on time (here for the interface: LAN1) |  Interface-Widget
| |||